Mapping of the transformation of London’s high streets in the wake of traffic-calming policies. Combined business listings, census data, and Voronoi clustering to explore how “symbolic capital” (boutiques, bakeries, galleries) concentrates in gentrifying zones.
Project outline
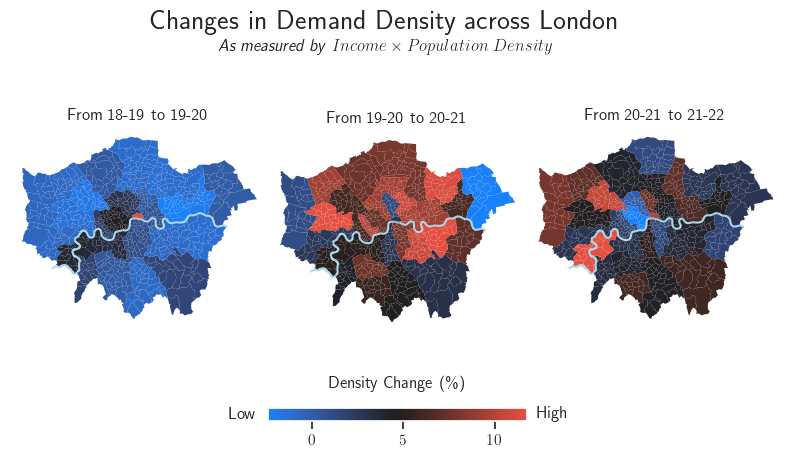
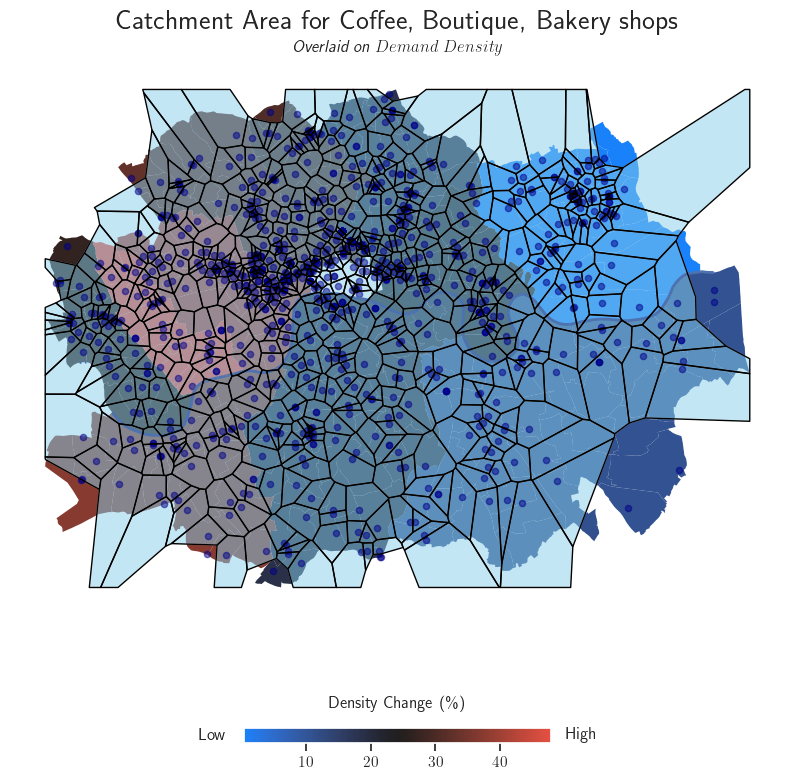
This project analyses the spatial relationship between Low-Traffic Neighbourhoods (LTNs) and “symbolic capital” retail in London (e.g. artisanal bakeries), using data from Companies House, OpenStreetMap, and income/demographic data from statistical agencies.
Key features:
- GeoPandas and NetworkX for road-network analysis
- Retail clustering and income-demographics overlays
- Great example of urban data storytelling
Media